




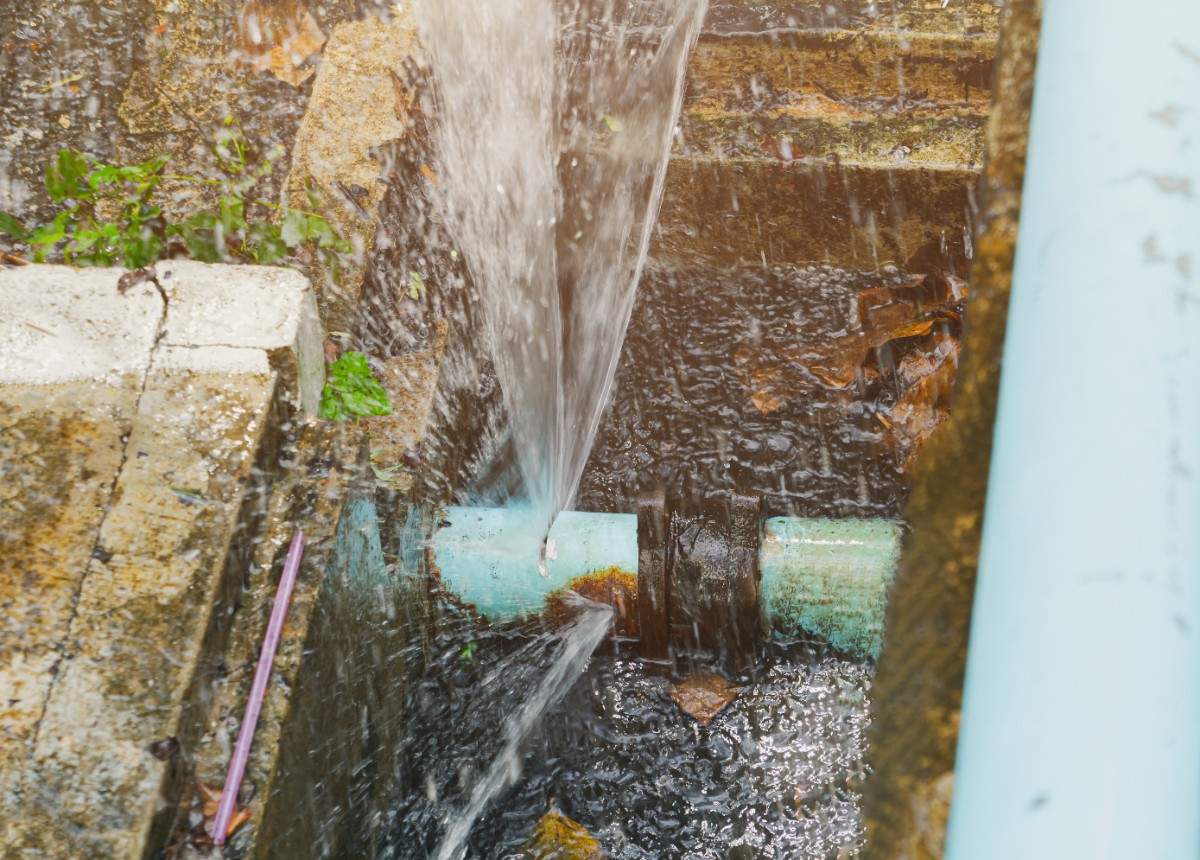
NRW smart leak management cuts non-revenue water loss. See how utilities detect leaks early and recover lost revenue with SMART360.
For US Utilities serving 3,000-100,000 meters and for operations team, billing team and utility managers. For Heads of Billing who own collections accuracy and revenue leakage.
NRW smart leak management is the use of meter data, network sensors, and analytics to reduce non-revenue water, which is the gap between water a utility produces and water it bills. In the United States, the average system loses 15 to 30 percent of treated water to leaks, meter inaccuracy, and unauthorized use, according to the EPA's Water Audits and Water Loss Control guidance. The fastest path back to that revenue is connecting smart leak detection to billing and meter data on one platform so apparent losses and real losses can be measured, prioritized, and reduced inside the same workflow.
Non-revenue water, usually abbreviated NRW, is the difference between the volume of water a utility puts into distribution and the volume it bills to customers. Every gallon in that gap is treated, pumped, and pressurized at full operating cost, then lost before it generates revenue. Across the United States, AWWA water audits using the M36 standard consistently find double-digit NRW percentages, even at well-run systems.
Two costs add up. The first is the operating cost of producing water nobody pays for: chemicals, energy, labor, treatment. The second is the lost revenue from the meter never spinning. For a 25,000-connection utility with NRW at 20 percent, those two costs combined frequently run into the low millions per year. NRW reduction is one of the few utility programs where a single sustained workflow improvement shows up directly on the income statement.
Utilities that treat NRW as a serious financial metric tend to manage it on a platform that connects field detection, meter data, billing, and customer service in one system. That is the case Bynry makes with SMART360 for water utilities, where leak detection events flow directly into work orders and billing exceptions instead of sitting in a separate spreadsheet.
Before any reduction program, the loss has to be sorted into categories. The AWWA M36 framework separates real losses (water that physically leaves the system) from apparent losses (water that is consumed but not measured or billed correctly). Inside those two groups, four sources cover almost every system:
A good NRW program does not start by chasing leaks. It starts by classifying losses, because the workflow and the cost of recovering each category is different. Real losses need detection technology and crew time. Apparent losses need meter replacement schedules and billing reconciliation.
A modern NRW workflow runs as a closed loop between detection, validation, action, and measurement. The steps below assume a utility with AMR or AMI meter data and at least basic GIS coverage of the distribution network.
Steps 3 and 4 are where most legacy stacks fall apart. Detection sits in one system, work orders in another, and meter data in a third. The leak gets found, the work order gets closed, and nobody updates the audit. The NRW number does not move.
Once the audit is complete, the most useful document an NRW team produces is a single-page table that splits the loss volume into recovery categories. It tells the GM and the board where the money is.
The ratio varies by system, but the pattern holds: unreported real losses are usually the largest line, and apparent losses are usually the cheapest to recover per gallon. A pragmatic NRW program attacks both at the same time, because the apparent-loss recovery funds the real-loss detection.
The investment case is straightforward to test before any budget request goes to the board. Walk through these four questions with your operations and finance leads:
1. If the number on the most recent audit is older than 18 months, the first investment is the audit itself, not the technology. AWWA M36 is the standard most state regulators accept, and the audit can be done in 30 to 60 days by an experienced operator.
2. Without DMAs, you cannot tell whether a 20 percent system-wide NRW number means one bad zone or twenty mediocre zones. DMA setup is usually a 90-day project for a mid-sized utility.
3. Apparent losses live at the meter-to-bill boundary. If meter reads come from one platform and billing runs on another with a nightly export, the discrepancies that drive apparent loss are invisible to both sides. This is the boundary where NRW smart leak management produces the highest ROI.
4. If the answer is no, every leak you find is a one-time fix instead of a permanent NRW reduction. The downstream meter keeps showing the same flow pattern because nobody on the billing side knows the upstream leak was repaired.
If three of the four answers are no, the right next step is to integrate the stack before adding more detection technology. More sensors on a fragmented stack just produce more orphaned alerts.
The strongest case for NRW smart leak management is the customer-service compound effect, not just the recovered revenue. When a leak is detected on a customer-side service line through AMI continuous-flow analytics, a single workflow can flag the meter, generate a service order, send the customer a high-bill notification, and credit the bill if the leak is verified, all in the same platform.
This requires water data and billing data on the same system. Utilities running water utility data management software that connects meter reads, consumption history, and billing exceptions in one record can run customer-side leak alerts as a standard automated workflow. Utilities running disconnected stacks usually run them as a manual escalation that misses most of the actionable cases.
Island Water Authority moved from a paper-to-screen billing process to a unified platform and reduced billing errors by 92 percent in the first year. NRW reduction was not the headline outcome, but the same data unification that eliminated billing errors also eliminated the data silos that hide apparent losses.
NRW programs at mid-sized US water utilities tend to follow a similar 90-day arc when they are run inside a unified platform rather than spread across separate systems.
Pull supply, billed consumption, and authorized unbilled consumption for the last 12 months. Calculate baseline NRW. Split the distribution network into 4 to 8 DMAs depending on system size. The deliverable is a one-page report showing NRW percentage, dollar value, and which DMAs are the highest-loss zones.
Deploy detection in the top 2 DMAs. Run statistical meter testing on the largest 50 commercial accounts. The deliverable is a leak candidate list ranked by probable volume and a list of meters scheduled for replacement.
Execute leak repairs as work orders that close back into the meter record. Replace under-registering meters. Re-run the audit calculation against the same 12-month window for a like-for-like comparison.
A 3 to 5 percentage point NRW reduction in 90 days is realistic for a system starting at 20 percent or higher. Utilities at 30 percent or higher often see 5 to 8 points in the same window because the highest-loss zones are easier to find. This pace becomes sustainable only when the workflow is integrated, which is why a clean platform foundation matters before adding detection hardware. The broader context for why US utilities carry these loss rates in the first place is covered in our piece on the top challenges US water utilities face.
There is no single regulatory threshold across the United States, but most state programs and AWWA peer benchmarks treat anything below 10 percent as well-managed and anything above 25 percent as a program in need of investment. The honest answer is that the right target depends on the cost to recover the next percentage point, which is why an audit and a DMA breakdown should come before a target.
Yes, but the workflow shifts. Without AMI, real-loss detection relies on acoustic loggers, pressure transients, and DMA-level minimum night flow analysis. Apparent-loss reduction still works through meter testing programs and billing reconciliation. AMI adds the customer-side continuous-flow detection layer that turns NRW reduction into a customer service win, but it is not a prerequisite for a meaningful program.
NRW data, broken down by DMA and by main type or vintage, becomes the empirical input to the capital plan. Pipe segments in high-loss DMAs with high break frequency are replacement candidates. Without DMA-level NRW data, replacement decisions usually default to age and material, which often misranks the network's actual risk.
Most programs at 3,000 to 30,000 connection utilities recover the audit and DMA setup costs within the first year through apparent-loss recovery alone. Real-loss detection investments typically pay back in 18 to 36 months, depending on the system's starting NRW percentage and the unit cost of water production.
Annually as a minimum, with the M36 spreadsheet as the standard format. Utilities running NRW as an active program re-baseline quarterly using the same methodology so detection investments can be tied directly to NRW reduction.
Bynry Inc.
8 The Green STE.R,
Dover, Kent,
Delaware 19901
+1 732-630-0285
Bynry Inc.
Serene Tower, Pakharbaug
Pune, Maharashtra 411021
+91 93252-51217